Using the Enron Email Corpus to quantify changes in
language and influence during key moments and for
important players, during the Enron Crisis (1999-2002)
1 Introduction
Based on the latest Version (May 7th, 2015) of the Enron Email Corpus, investigate the internal communications of Enron employees throughout the company’s collapse (1999-2002), use the data to analyse:
- Natural Language Analysis: Are there distinct changes in email frequency, sentiment, or n-gram usage during known periods of financial crisis compared to standard operating periods?
- Social Network Analysis: Do the social network structures (communities) and measures of influence (centrality/ PageRank) change in meaningful ways as the company nears bankruptcy? How does the influence of key figure, CEO Jeffrey Skilling, evolve?
- Model Adequacy: How adequate is the Enron Corpus and standard sentiment analysis (VADER) for retrospectively modelling complex organizational tensions?
2 Chosen Problem
The Enron email corpus is the largest publicly available corpus of email data; it was released by the Federal Energy Regulatory Commission during their investigation in 2003 (1). The corpus was first explored in a 2004 conference (2), and has been used to study social networks, email, and natural language ever since. This corpus was used to train Natural Language models as part of the CALO Project (3), which was used in the creation of Siri.
Enron was an American energy and commodities trading company, well known for their accountancy fraud scandal and one of the largest corporate bankruptcies in history. It was founded in 1985 by Ken Lay, who would later appoint chief executive Jeffrey Skilling. In 2006 they would both be put on trial and found guilty for the widespread internal fraud which became public in October 2001 (4).
The two major key moments in the Enron scandal were the rapid decline in their stock price caused by speculation, and later public knowledge, of their fraud, and their declaring bankruptcy.
While there exists a body of work exploring this corpus, this report focuses specifically on quantifying how the email dataset reflects changes in social structure and organizational tension during these moments of crisis.
3 Data Collection
The latest version (May 7th, 2015) of this dataset was sourced from the Carnegie Mellon Computer Science page on the corpus and research done using it (1). This export was a tar.gz file that, when uncompressed, gave Windows-incompatible '.' file extensions, and so the zipped tar file was used during preprocessing. All of the data was extracted from the tar.gz, and converted to more usable, formatted, CSV files for different representations of the data.
This included conducting Sentiment Analysis using the VADER model from the Natural Language Toolkit (NLTK) (5), so that the general sentiment of the company could be modelled over time.
The dataset is usable for both text and social network modelling, as emails provide both natural language over time and directed connections between employees of the company. This makes it appropriate for the question of modelling differences during periods of tension within Enron, as it will be able to give insight into both what is being discussed and with whom when things go wrong.
The dataset was pruned to remove any emails that landed outside of the email addresses of executives in the dataset so that only edges relevant to the graph between them would be considered. After this, the Graph consisted of 146 nodes and 2132 edges.
4 Computational Models Used
At the most basic level, the frequency of emails over time was mapped in comparison to the fluctuation of the closing stock price of Enron (ENE) (6). In addition to this, the proportion of emails of positive and negative sentiment were modelled, as based on the compound score from the NLTK VADER model.
Next, the frequency of different words, bigrams, and trigrams were modelled from the two key time frames identified in the above, in comparison to the entire corpus.
The internal email data was also used to create a directed Graph — with users as nodes (which can have multiple email aliases in the original dataset) and directed edges modelling emails being sent, with weights on each edge corresponding to how many emails were sent. Communities are identified via Clauset-Newman-Moore greedy modularity maximization in networkx (7), which are then visualised with different colours to identify different departments and other like nodes (employees) throughout the community. The betweenness centrality and PageRank of each node is also calculated to model the importance of nodes within the entire timespan of the dataset, and during particular moments of interest.
5 Results
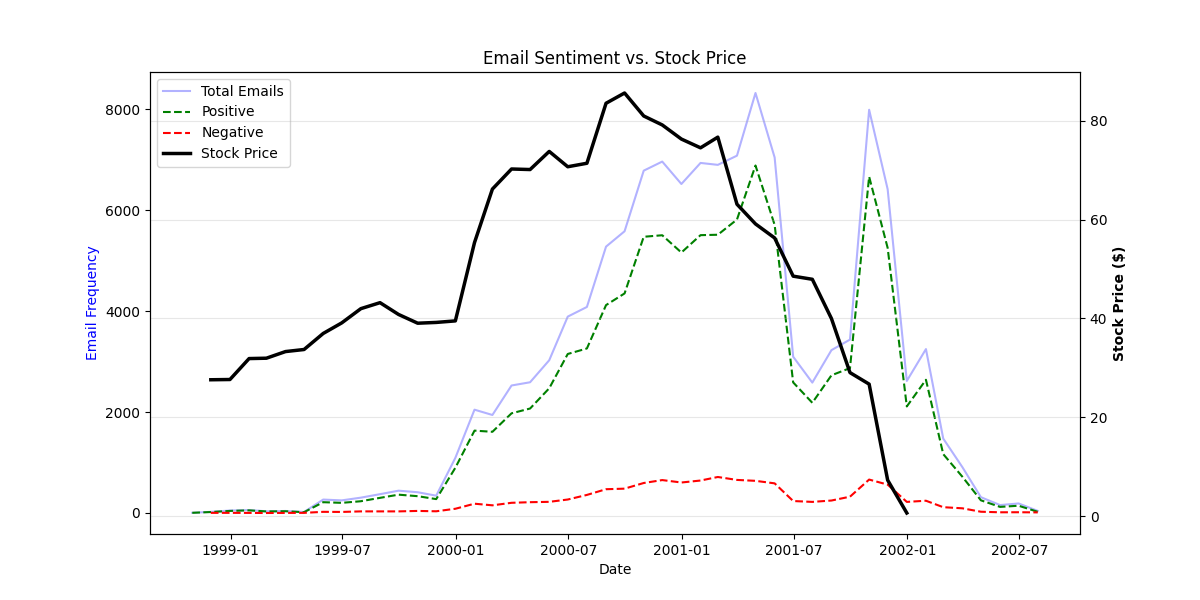
Plotting the frequency of emails/ frequency of positive and negative sentiment emails alongside the Enron stock price (6) reveals two major spikes in activity within the dataset (Figure 1). The first being around Feb–June 2001, and the second being Oct–Dec 2001. These directly correlate with times of crises at Enron, with the beginning of their stock’s decline, followed by their bankruptcy in Dec 2001.
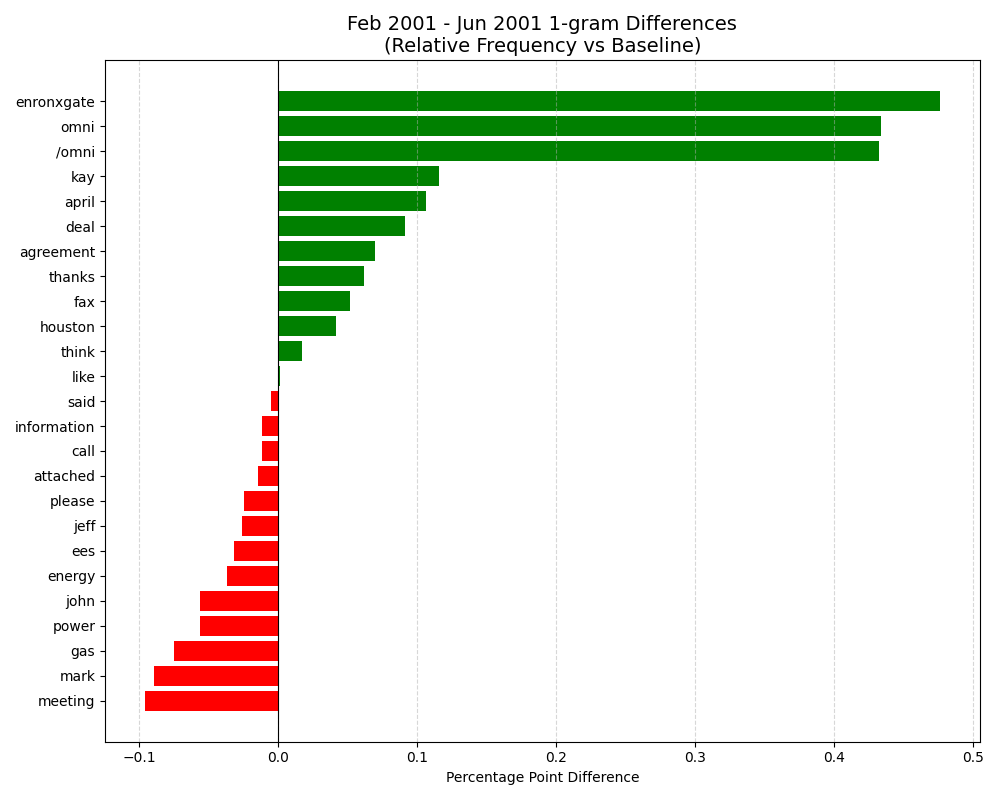
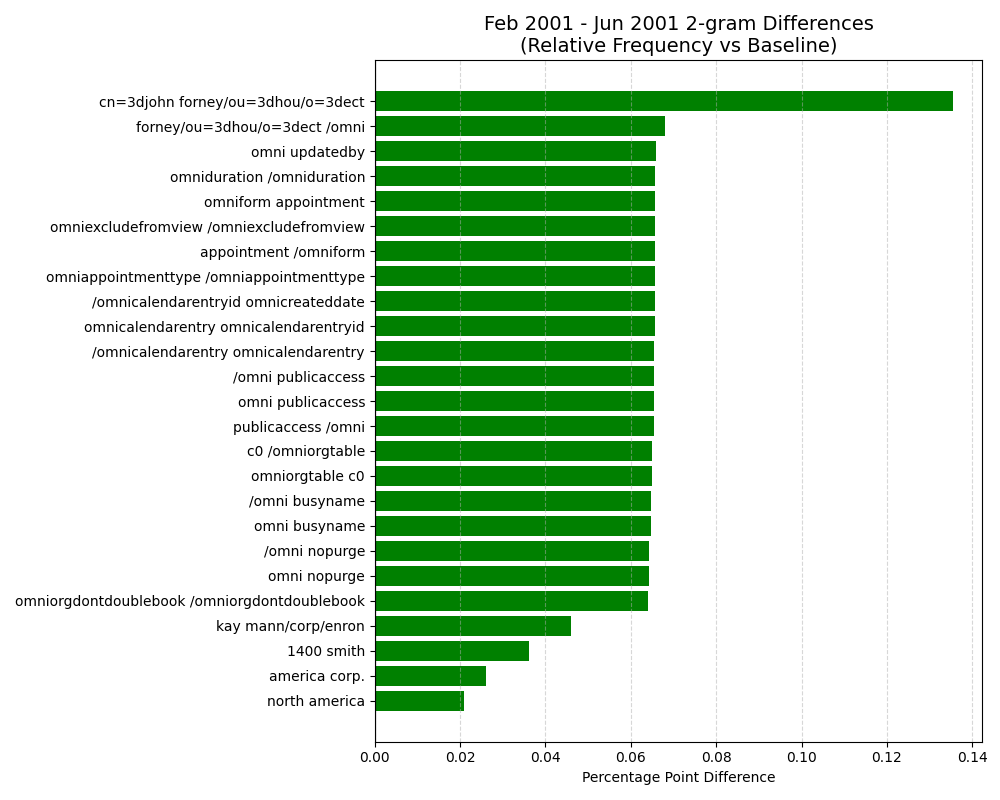
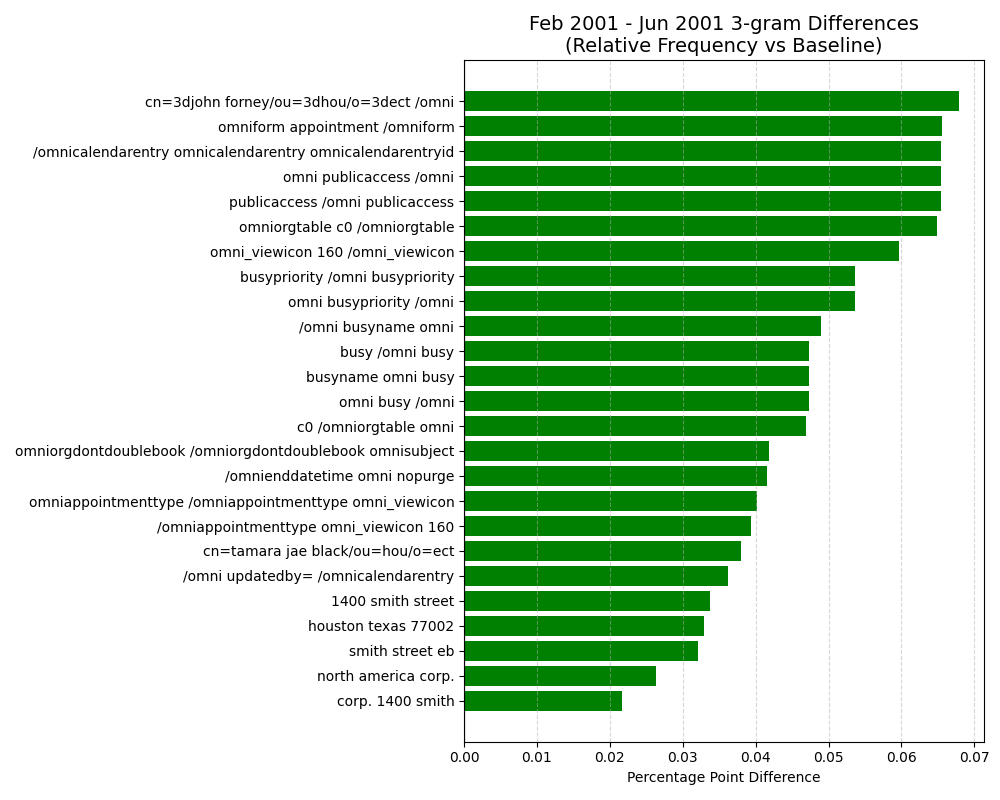
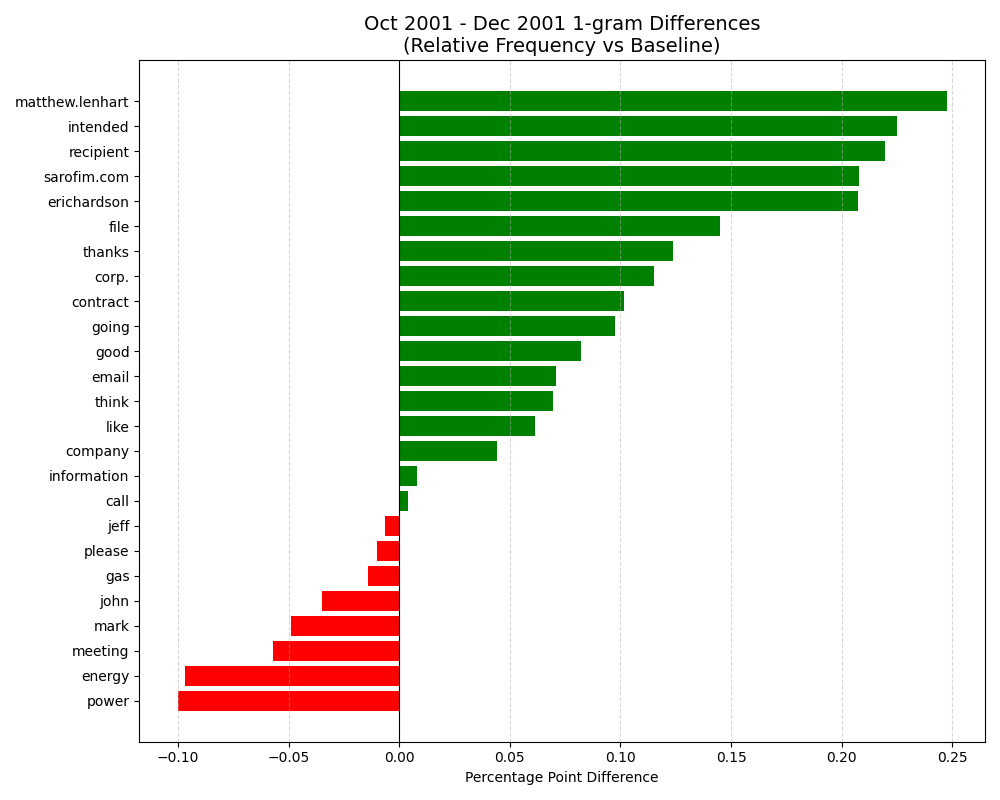
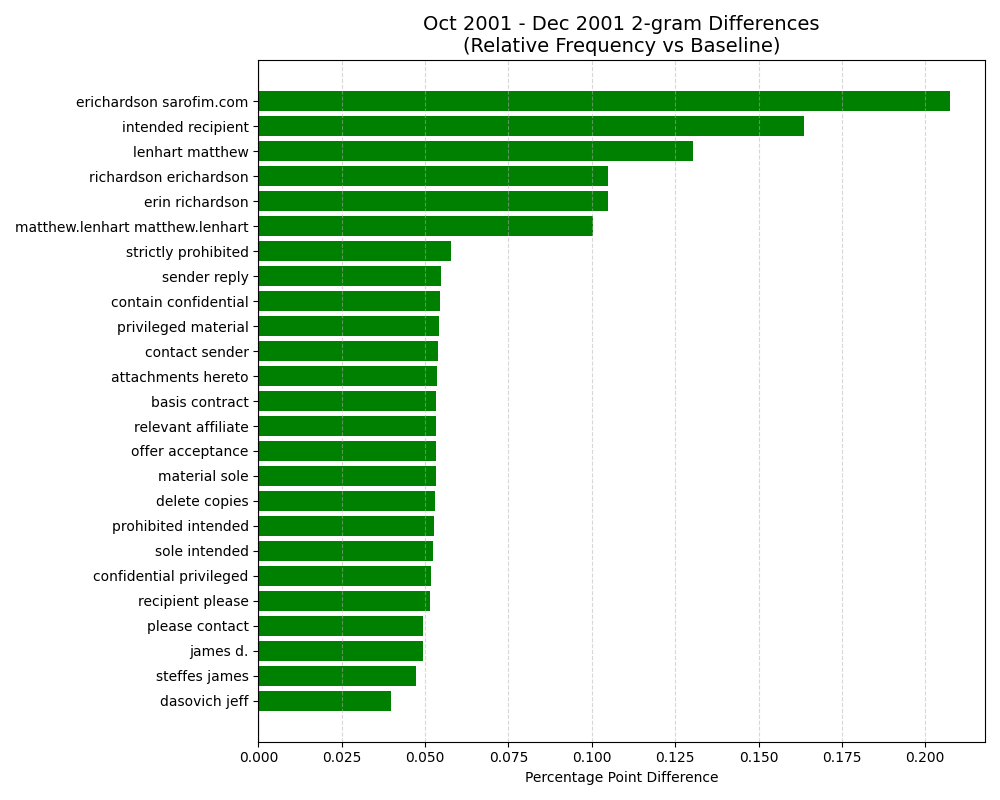
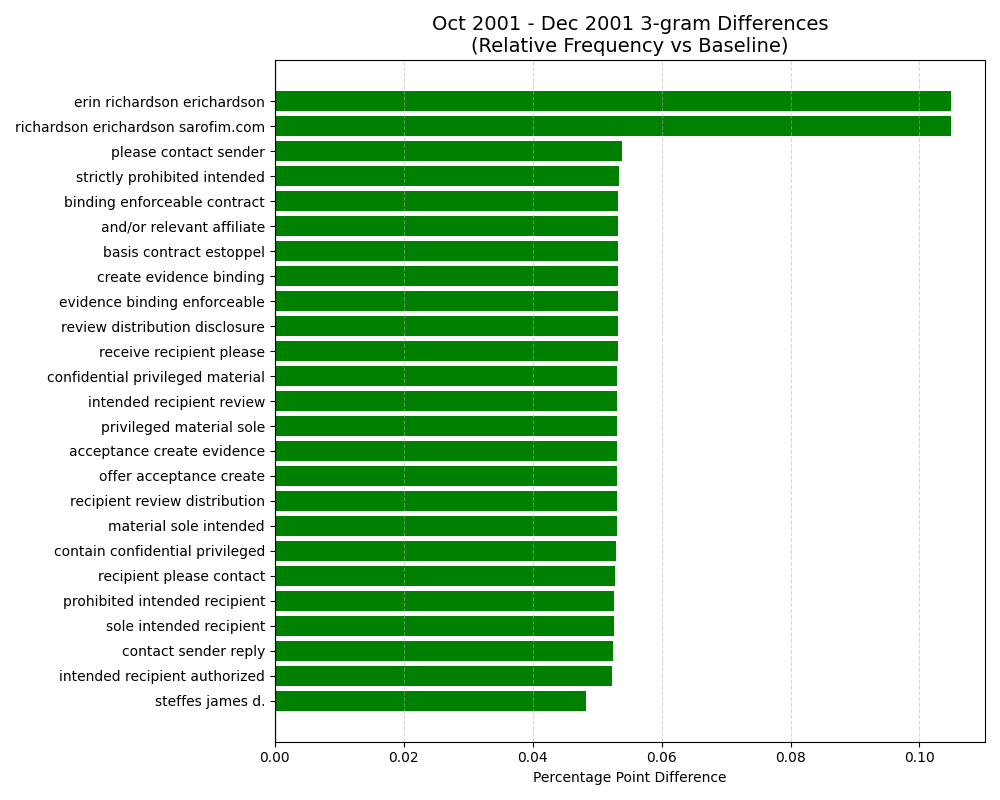
Through N-gram frequency comparisons (Figures 2–7), it is revealed that Enron emails are less likely to have words like ’please’ and ’thanks’ in them during points of crisis. Key words from the crises are also included, such as ’enronxgate’, and other normal phrases for the business, like ’gas’, are often underused as people talk more about the current issue.
Another interesting n-gram feature of note are the 2- and 3-grams from Oct–Dec, when the fraud had become public, as features of a legal disclaimer email footer become very common; with phrases like ’binding enforceable contract’, ’confidential privileged material’, and ’please contact sender’ making up parts of the disclaimer.
Jeffrey Skilling was the CEO of Enron Finance Corp, and was convicted of federal felony charges in relation to the Enron Scandal. He resigned from his position in August 2001. Consequently, he exhibits high centrality in the first period (Feb–Jun), but this influence vanishes in the second period (Oct–Dec). Despite Sally White Beck sending mail to his inbox during the second crisis, his resignation effectively removed a central hub from the network, contributing to the more divided community structure observed in Figure 10 compared to Figure 9.
Table 2 and Table 3 identify this shift in power. As the crisis deepened, influence consolidated around operational leaders. For example, John J. Lavorato (COO of Enron America) saw his PageRank rise from 0.0372 in the first peak to 0.0433 in the second (Table 4). This models a change in leadership style, where remaining executives absorbed a higher proportion of communication traffic as the company collapsed.
| Name | Emails_Rec | Emails_Sent | PageRank | Betweenness |
|---|---|---|---|---|
| lavorato-j | 1021 | 843 | 0.0359 | 0.1084 |
| presto-k | 882 | 705 | 0.0333 | 0.1085 |
| kean-s | 720 | 2718 | 0.0309 | 0.0753 |
| sturm-f | 591 | 111 | 0.0255 | 0.0415 |
| allen-p | 632 | 553 | 0.0236 | 0.0403 |
| grigsby-m | 316 | 933 | 0.0220 | 0.0318 |
| shapiro-r | 1474 | 6 | 0.0188 | 0.0001 |
| mcconnell-m | 466 | 304 | 0.0187 | 0.0325 |
| steffes-j | 625 | 740 | 0.0182 | 0.0372 |
| hodge-j | 1984 | 33 | 0.0177 | 0.0193 |
| Name | Emails_Rec | Emails_Sent | PageRank | Betweenness |
|---|---|---|---|---|
| lavorato-j | 184 | 233 | 0.0372 | 0.2295 |
| kean-s | 114 | 664 | 0.0306 | 0.0798 |
| presto-k | 143 | 81 | 0.0261 | 0.0589 |
| allen-p | 125 | 188 | 0.0223 | 0.0677 |
| shapiro-r | 410 | 2 | 0.0207 | 0.0004 |
| grigsby-m | 66 | 164 | 0.0179 | 0.0327 |
| hodge-j | 457 | 8 | 0.0171 | 0.0187 |
| lenhart-m | 73 | 88 | 0.0170 | 0.0093 |
| love-p | 36 | 92 | 0.0159 | 0.0133 |
| sanders-r | 152 | 87 | 0.0142 | 0.0080 |
| Name | Emails_Rec | Emails_Sent | PageRank | Betweenness |
|---|---|---|---|---|
| lavorato-j | 154 | 30 | 0.0433 | 0.0497 |
| presto-k | 86 | 184 | 0.0412 | 0.2971 |
| storey-g | 51 | 19 | 0.0270 | 0.0454 |
| sturm-f | 66 | 7 | 0.0245 | 0.0140 |
| arnold-j | 81 | 113 | 0.0237 | 0.0308 |
| allen-p | 100 | 25 | 0.0235 | 0.0225 |
| white-s | 80 | 43 | 0.0232 | 0.0930 |
| grigsby-m | 58 | 440 | 0.0203 | 0.0674 |
| watson-k | 83 | 141 | 0.0187 | 0.0075 |
| whalley-l | 45 | 9 | 0.0186 | 0.0203 |
| Name | P1_PageRank | P2_PageRank | Change |
|---|---|---|---|
| lavorato-j | 0.0372018 | 0.0432506 | 0.00604887 |
| presto-k | 0.0260868 | 0.0412116 | 0.01512490 |
| storey-g | 0.0043624 | 0.0269995 | 0.02263710 |
| sturm-f | 0.0132193 | 0.0245101 | 0.01129080 |
| arnold-j | 0.00920576 | 0.0236814 | 0.01447570 |
6 Critical Evaluation
The VADER model (5) from NLTK was limited in utility, with a rough split of 80% positive, 20% negative. This is due to it being designed for single-sentence sentiment analysis rather than full emails, as well as the greater nuance of sentiment through email language. If further work is explored, then a different method for sentiment analysis, i.e. using 2-grams, would be beneficial to explore.
However, the N-gram frequency analysis was able to reveal patterns in language around the spikes in activity which did indicate changes in tone and topic of conversation, which allowed for similar utility in answering the question of how language changes during crisis.
Email data was really useful for creating a directed weighted graph that pretty accurately modelled the connections and interactions between employees at Enron over time. The corpus, of course, limits inter-company communications to sent emails — ignoring all other communication such as meetings or memos at a time when digital adoption was far lower. An assumption is also made in the dataset that emails sent on behalf of executives (i.e. Pam Butler on behalf of Phillip Allen) count as communication being sent by them. However, this is an example of survivorship bias, as the only emails that were published were from executives being investigated.
My analysis of community structure differs from the findings of Diesner et al. (8), who found that communication became ’more diverse’ and bypassed formal chains during the crisis. Unlike Diesner’s findings, my graphs show that the groups actually broke apart. Communities became more separate rather than mixing together.
This difference in finding is likely due to the survivorship bias I discussed earlier. By pruning the dataset to include only edges between the 146 core executives (removing the effect of other people writing emails on their behalf), my model captures a different reaction from leadership to that of the wider company.
7 Conclusions
The frequency of emails over time very accurately modelled the times of crisis that this report was interested in, and so was invaluable in refining the data during the preprocessing step. Unfortunately, the attempted model for sentiment was not suitable for the dataset; however, there were plenty of non-sentiment based conclusions to draw.
For example, within natural language analysis, the frequency of words, bigrams, and trigrams in comparison to the entire corpus showed that employees were less likely to use polite language during periods of financial crisis, as well as identifying a common legal disclaimer added to emails after the fraud became more widely known.
Within social network analysis, communities became more divided in times of crisis and during that latter part of the Enron scandal. The influence of Jeffrey Skilling is obvious during the first crisis, before his resignation in August 2001 — and reduces to zero after his departure — which affected the diverging nature of the communities of the graph.
Higher-up executives at Enron, who were already modelled as nodes with on average higher measures of centrality/ importance, become more central during the times of crisis — which reveals the change in leadership style.
References
[1] W. Cohen, “Enron Email Dataset,” May 2015. [Online]. Available: https://www.cs.cmu.edu/~enron/
[2] B. Klimt and Y. Yang, “Introducing the Enron Corpus,” in First Conference on Email and Anti-Spam (CEAS), 2004 Proceedings, Mountain View, CA, Jul. 2004. [Online]. Available: https://ceas.cc/papers-2004/168.pdf
[3] S. R. I. International, “75 Years of Innovation: CALO (Cognitive Assistant that Learns and Organizes),” Jul. 2020. [Online]. Available: https://www.sri.com/75-years-of-innovation/75-years-of-innovation-calo-cognitive-assistant-that-learns-and-organizes/
[4] “The Enron Trial: A Chronology.” [Online]. Available: https://famous-trials.com/enron/1789-chronology
[5] C. Hutto and E. Gilbert, “VADER: A Parsimonious Rule-Based Model for Sentiment Analysis of Social Media Text,” Proceedings of the International AAAI Conference on Web and Social Media, vol. 8, no. 1, pp. 216–225, May 2014. [Online]. Available: https://ojs.aaai.org/index.php/ICWSM/article/view/14550
[6] M. Woźniak, “Enron Stock Prices,” 2020. [Online]. Available: https://www.kaggle.com/datasets/martynawoniak/enron-stock-prices
[7] A. Clauset, M. E. J. Newman, and C. Moore, “Finding community structure in very large networks,” Physical Review E, vol. 70, no. 6, p. 066111, 2004.
[8] J. Diesner, T. L. Frantz, and K. Carley, “Communication Networks from the Enron Email Corpus: "It's Always About the People. Enron is no Different.",” 1 2005. [Online]. Available: https://kilthub.cmu.edu/articles/journal_contribution/Communication_Networks_from_the_Enron_Email_Corpus_Its_Always_About_the_People_Enron_is_no_Different_/6621398